Breakpoint Detection Tool
Is there a point in your time series where something changes significantly?

Product Description
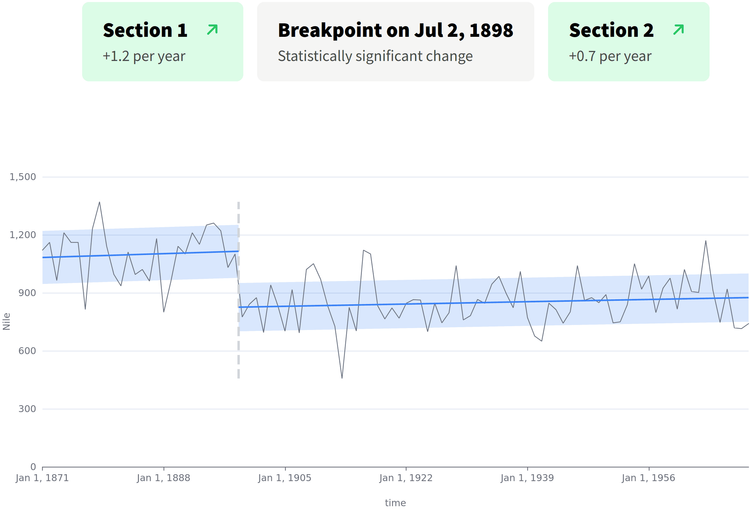
Find out if your time series data changes at a certain point by using the free breakpoint detection tool. This tool runs statistical tests to identify significant changes in data trends. Users can upload CSV files containing time series data, and the tool will generate visualizations with detected breakpoints and trend lines. All operations are done in the browser, ensuring that data remains private.
Core Features
- Detect significant changes in time series data.
- Use statistical tests like the Chow test to check for statistical significance.
- Visualize data with plots showing detected breakpoints and trend lines.
- Runs entirely in the browser, ensuring data privacy.
FAQ
How does the breakpoint detection tool work?
Drag & drop your CSV file onto the blue area above, or select a file from your computer. The file should be in CSV format and it can contain multiple columns. There should be at least one column with dates or times, and one column with numerical values.
Why do I need breakpoint detection?
Statistics is tricky. Sometimes, it looks like your data changed direction at a certain point, or made a sudden jump. But often this could be just random variation. Breakpoint detection helps you find out if the change in your data is very likely to be real.
How do I interpret the results?
Once the calculations and tests are done, the tool will show you a plot of your data with the detected breakpoint marked. It will also generate explanations that help you understand the results.


